Evidence of Stock Market Decline Is Everywhere: Here Are Top Five Indicators
The much-anticipated stock market decline could be imminent. At least according to five important indicators that are widely followed by investors. Knowing these indicators is especially important in today’s market environment.
We’ve feverishly documented the bearish case for equities for a while on Lombardi Letter. But we’re not alone in our negative leanings. Some of the biggest fund managers in the world are thinking along the same lines.
Advertisement

Ray Dalio (CIO at Bridgewater Associates, LP), Jeff Gundlach (Founder of DoubleLine Capital LP), Howard Marks (Co-Chairman of Oaktree Capital Group LLC (NYSE:OAK))…the list goes on. It isn’t just the “alt-right” investment contrarians sounding the alarm on the markets. The biggest funds and investment managers in the world are doing the same thing.
It’s rare that the contrarians and mainstream Wall Street pundits think along the same lines. When Peter Schiff’s pontifications of doom are similar to those of JPMorgan Chase & Co.’s (NYSE:JPM) chief equity strategist, something’s up. It signifies the importance of paying attention to the signs.
So now that I (hopefully) have your attention, you may be asking “what indicators are the pros using to come to these conclusions?” After all, an analysis is only as good as the information it’s derived from.
The answer to that question is nuanced. The experts look at all the same indicators that the general public does. But the difference is, they have proprietary indicators that the public does not have access to. Some of those are built in-house and others are gathered through research, which can only be accessed by those with deep pockets.
In the end, there’s no magic formula. The experts and their research teams still have to parse through enormous amounts of data to reach proper conclusions. And just because deep-pocketed funds may pay hundreds of thousands of dollars for research, it doesn’t make it more valid than data that is publicly available online. Economic data is economic data; it doesn’t conform a certain way just because you’re rich and powerful.
So without further ado, below are five indicators that Lombardi Letter is scanning to help us reach our bearish positions. In isolation, nothing necessarily suggests that there will be a stock market decline tomorrow or next week. But the totality of data is impossible to ignore. Nobody rings a bell at the market top. It’s a death match between bulls and bears that can yield only one victor.
Five Signs Pointing to Stock Market Decline
1. Commercial and Industrial Loan Growth
This key indicator is one of the most accurate ones around. It is “eight for eight” in regard to predicted U.S. recessions and subsequent stock market declines since 1960. No false signals; no false dichotomies.
This indicator’s importance makes sense when you consider that it’s directly tied into major industrial and commercial developments. The kind that drive economic activity pre- (construction, capital expenditure) and post- (i.e. manufacturing output, retail sales) loan utilization. In other words, it finances the commercial business expansions that make the economy hum.
So when the demand for such loans declines, it signals two important things: 1) business loans mean less profit for the banks and spin-off beneficiary industries that feed off of them (i.e. construction); and 2) contracting credit demand is a reliable indicator that the business community believes economic growth has peaked. It usually doesn’t make sense to raise capacity when economic demand is contracting or about to fall into recession.
So it’s troubling that this important indicator is hanging in the balance. It hasn’t had three consecutive month-over-month (MoM) declines yet, but it has come close. It experienced two MoM declines earlier in the year, only to edge up since April. But it has essentially flatlined. The odds are heavily stacked against a re-ignition of growth, especially since the commercial and industrial (C&I) credit wave since the U.S. Housing Bubble is by far the largest in history.
I strongly believe that this indicator will go “nine for nine” in predictive ability quite soon.

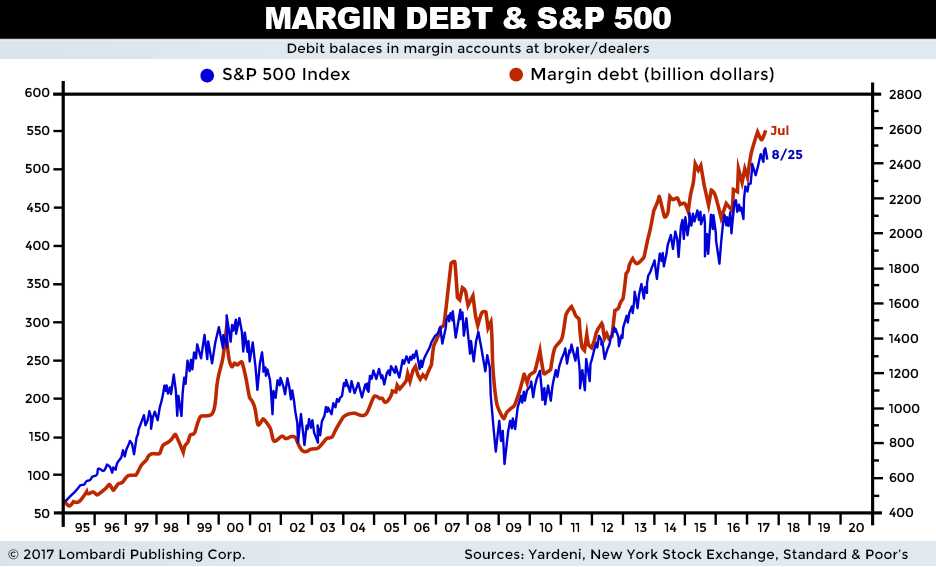
2. Record High S&P 500 Margin Debt
Simply put, margin debt has fueled this epic run higher. If you have any doubts, see the chart below. There isn’t anything wrong with this fact either; margin debt should expand and be taken advantage of when the economy is growing and stocks are cheap. The only problem is, neither of these conditions are true any longer.
I won’t go into much detail because both facts are widely known. The cyclically adjusted price-to-earnings (CAPE) ratio is sitting at its third-highest point ever recorded (around 30). That’s a big deal, since the CAPE ratio is the gold standard of market valuation metrics. It calculates price divided by 10 years of corporate earnings, then adjusts for inflation. So it’s reliable because it’s not subject to extreme data set volatility, which can render other valuation metrics useless. (Source: “U.S. Stock Markets 1871-Present and CAPE Ratio,” Yale University, last accessed August 28, 2017.)
Then we have a business cycle which is past its peak. Several Wall Street institutional analysts have publicly expressed their belief that the business cycle may be heading for a downturn. For example, HSBC Holding PLC published a “Seven Select Indicators Of Credit Bear Markets” table and found that four of the seven indicators showed late-stage activity while three of the seven indicated mid-stage activity.
Another example: for the first time in over a decade, companies that outperformed analysts’ profit and sales estimates across 11 sectors saw no price boost from investors. “This lack of a reaction could be another late-cycle signal, suggesting expectations and positioning already more than reflect good results/guidance,” wrote Savita Subramanian, Bank of America Merrill Lynch’s head of U.S. equity division. (Source: “Wall Street Banks Warn Downturn Is Coming,” Bloomberg Markets, August 22, 2017.)
Bottom line: expensive markets and business downturns are like oil and water. They are polarizing forces to one another. Throw in the record high margin debt (which is highly correlated to market returns), and this indicator screams “Stay out of the market.” At least in the majority of sectors.
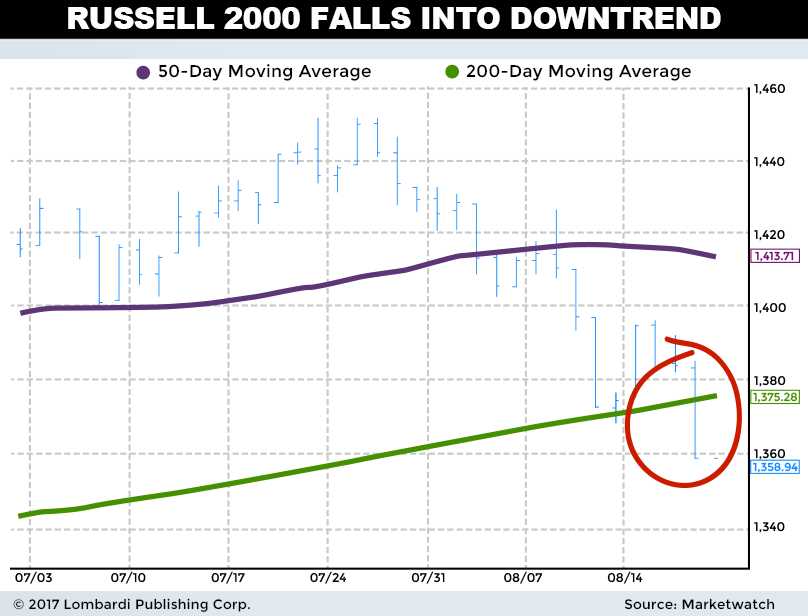
3. Russell 2000 Is Breaking Down
The Russell 2000 has slumped into a downtrend. This small-cap index bellwether is often a leading directional indicator for the major indices. Why? Because small-cap stocks are more sensitive to changes in the business cycle (both start and end).
On the upside, smaller companies are more fluid and can react to changes in consumer demand better than their larger counterparts. This helps when the business cycle fires up and companies and consumers are looking to expand quickly. But when the business cycle starts to crest, small-cap companies often experience the first pangs of reduced demand. They simply don’t have the brand recognition or pricing power to last deep into a downturn.
When this happens, this price action reflects itself in the Russell 2000 Index. It’s possible that this could only be a temporary blip; time will tell. But the breakdown could also reflect something more sinister. That is, the business cycle has peaked and corporate earnings are about to embark on a multi-quarter downward phase.
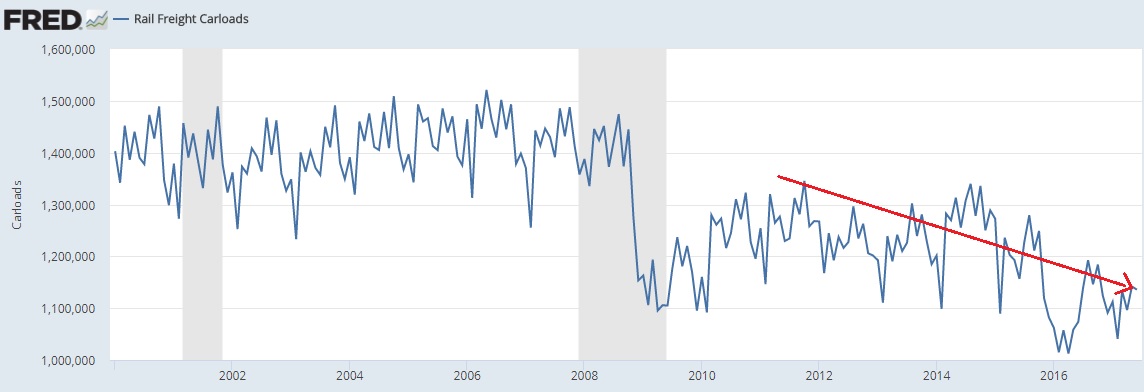
4. Rail Freight Carloads Fail
This one caught my attention because it just doesn’t seem right. Rail freight carloads hit a two-decade low in April 2016, and have been shuffling along ever since. This cannot be positive for manufacturing output.
Granted, this metric means less than it used to. Technology has grabbed a bigger slice of the equity market pie, as companies like Apple Inc. (NASDAQ:AAPL), Facebook Inc (NASDAQ:FB), and Amazon.com, Inc. (NASDAQ:AMZN) accrue ever bigger slices of the overall market capitalization.
But still, this chart tells us that fewer raw and finished goods are moving from place to place across America. This will have negative impacts on important factors like wage growth, total hours worked, and total manufacturing output. A robust economic expansion cannot be built on technology and outsourcing alone. Perhaps that’s why we’ve been mired in such tepid growth so long, with decreasing productivity gains to boot.
Regardless, another new low in rail freight carloads could point to a recession and subsequent stock market decline. We are precariously close to this level.
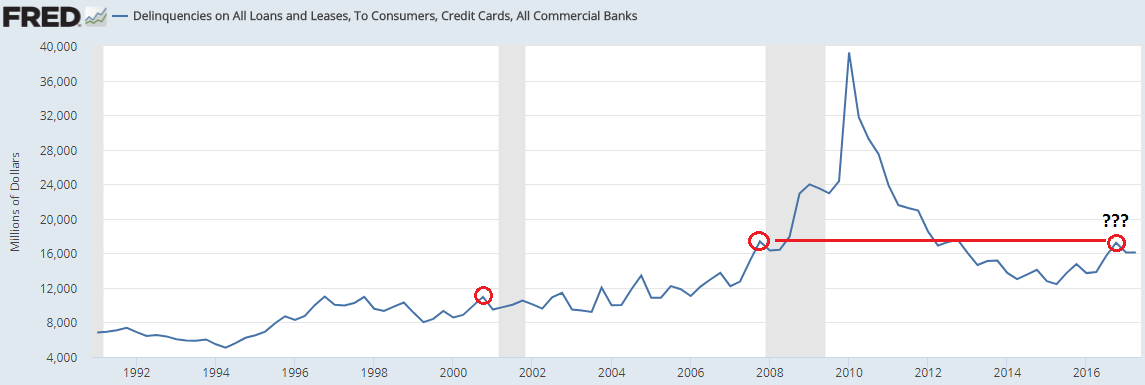
5. Delinquencies on the Rise
When consumers and businesses start defaulting on their loans, the consequences are obvious. Financial stocks get hammered as they are forced to write down bad debt. Demand for new credit dries up from the impaired, which is a significant chunk of the economy. Nor does this portend well for those who can pay their bills.
Even worse, rising delinquencies is a tax on future growth. When credit scores get decimated, it can take years to repair the damage. American credit scores are now topping all-time highs reached just before the U.S. Housing crisis, but it took almost a decade to get back to that level. Consumers who default usually don’t seek new credit anytime soon.
The chart below shows that the nominal value of delinquencies has reached pre-Housing Bubble levels. But the problem is, interest rates are half of the pre-bubble peak. While interest payments as a percentage of outstanding debt are much lower, delinquencies are still rising. That’s a troubling development.
Unless interest rates can continues trending lower, it’s hard to see how a recession and stock market decline won’t follow. Remember, historically low interest rates only produced average gross domestic product (GDP) growth of around two percent from 2010–2017. If delinquencies are trending up in such an environment, any meaningful increase in consumer interest rates will be devastating. A stock market decline will follow.